
View Values over Time for a Collection of Metrics.
Overview:
The Table Grouped View displays the values of all metrics in each container as rows in a table for the period value selected in the Global Filter as shown in the illustration.
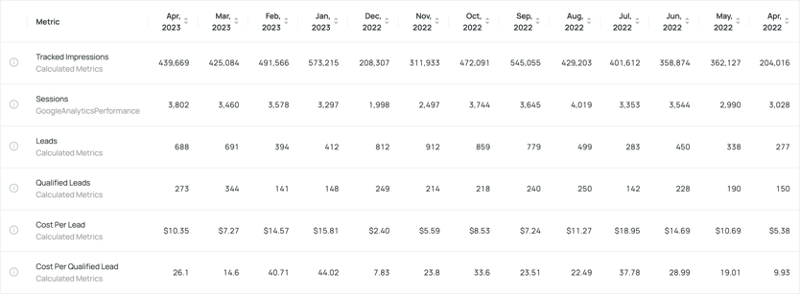
The Table is generated using the current value of the Global Filter and the prior 12 periods. This view is useful for users to compare a set of metrics period over period by inspecting the columns. Users can click on the header of any given period to sort by that specific column. Sorting represents three states – ascending, descending, and none. Users can also right-click on any period column header to pin that column to the right or left of the table to scroll through the remaining periods for comparison.